Midterm elections: Potential political shifts and market volatility
- 10.08.26
- Markets & Investing
- Article
A look at potential political shifts and short-term market volatility drivers as the midterm elections approach.
As Election Day approaches, investors may be asking what the upcoming midterm elections could mean for policy and markets. While there may be potential shifts in control, the policy impact is likely to be limited. Meanwhile, political rhetoric tends to heat up as elections draw closer, which could lead to an uptick in market volatility.
Democratic control of Congress would bring limited policy change
Divided government is historically more common than unified control. Since 1980, Washington has been under unified control for only 14 of the last 46 years – or about 30% of the time – and only once, from 2003 to 2006, did that last longer than two years. Looking at the 11 midterm elections since 1980, the party out of power gained control of one or both chambers in 10 of them, with 2002 being the lone exception.
While history is never destiny, it suggests Democrats enter November with the wind at their backs and are positioned to do well on Election Day. However, Democratic control of Congress would bring limited policy change. Divided government often leads to legislative gridlock because major legislation typically requires bipartisan support to advance.
Even if Democrats were to flip both the House and Senate after the upcoming elections, President Trump would remain in the White House until January 2029 and retain the power to veto legislation passed by Congress. Ultimately, the Trump administration will continue to control the executive branch and pursue many of its policy priorities through executive action. As a result, the primary check on the White House is likely to remain the courts, which, as illustrated by the Supreme Court’s ruling against the International Emergency Economic Powers Act tariffs, can play a significant role in shaping policy outcomes.
State-level elections and sector-specific policy implications
With 39 states holding gubernatorial elections and 46 states holding elections for one or both chambers of their legislature, there are likely to be some flips, potentially in both directions. To the extent that state-level policies may change, some sectors could be more affected than others.
An important example is the utilities sector. Traditional utilities, as distinct from independent power producers, are regulated by state-level utility commissions. Members of these commissions can be directly elected or appointed by governors. With data centers fueling electricity demand and leading to heftier utility price hikes, the politics of utility regulation has taken center stage. Recent policy actions in New York and Pennsylvania serve as reminders that a wide range of infrastructure development is subject to state-level rules. In recent months, New York’s governor imposed a one-year pause on new data center approvals, while Pennsylvania’s governor also tightened regulations.
By contrast, public policy for the health care sector is largely dominated at the federal level, given the central roles played by Medicare, Medicaid, the Food and Drug Administration and the Centers for Disease Control.
Impact of midterm elections on the equity market
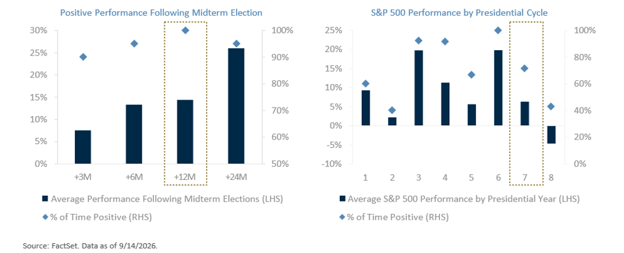
Politics is only one of countless variables that influence the markets. Correlation between elections and stocks is not the same as causation. That being said, history shows that 100% of midterm elections after World War II were followed by positive performance for the S&P 500 over a 12-month period, with the market up by an average of approximately 15%.1
There is also a correlational relationship between stocks and the presidential cycle. Given that President Trump is the only modern-era president to serve nonconsecutive terms, 2027 will technically mark the seventh year, rather than the third year, of a Trump presidency. Historically, the seventh year has been associated with more modest market gains, though history is only one factor investors should consider.
As a note of caution about the period leading to the midterm election, this tends to be a time when political rhetoric heats up. Candidates may find it politically advantageous to target rhetorical attacks against certain industries. For instance, oil and gas, data centers and pharmaceuticals are routinely mentioned. While rhetoric is not the same thing as policy, it could temporarily contribute to short-term market volatility.
Bottom line
With the midterms approaching, both history and current polling suggest Democrats are well positioned to make gains. Control of the House appears increasingly likely, while the Senate remains highly competitive and could ultimately go either way. Regardless of the outcome, President Trump’s veto power means Congress is unlikely to do much over the next two years. Meanwhile, as the midterms approach, political rhetoric tends to heat up, which could lead to an uptick in market volatility. Once the midterms are behind the market, attention is likely to shift quickly toward the 2028 presidential race.
1Source: FactSet. Data as of 9/14/2026.
All expressions of opinion are those of Raymond James & Associates, Inc. (RJA) Investment Strategy and are subject to change. Nothing in this report constitutes investment, legal, accounting or tax advice or is a representation that any investment or strategy is suitable or appropriate to your individual circumstances or otherwise constitutes a personal recommendation to you. This information should not be construed as a recommendation. The foregoing content is subject to change at any time without notice. Content provided herein is for informational purposes only. There is no guarantee that these statements, opinions or forecasts provided herein will prove to be correct. Past performance is not a guarantee of future results. Indices and peer groups are not available for direct investment. Any investor who attempts to mimic the performance of an index or peer group would incur fees and expenses that would reduce returns. No investment strategy can guarantee success. Economic and market conditions are subject to change. Investing involves risks including the possible loss of capital. The information has been obtained from sources considered to be reliable, but we do not guarantee that the foregoing material is accurate or complete. Diversification and asset allocation do not ensure a profit or protect against a loss. Further, portions of this report may include content generated, sourced, or created with assistance from artificial intelligence tools. Raymond James has reviewed and considers this content to be reliable, but Raymond James does not guarantee that such content is accurate or complete.
S&P 500: This index is a broad-based measurement of changes in stock market conditions based on the average performance of 500 widely held common stocks. It consists of 400 industrial, 40 utility, 20 transportation, and 40 financial companies listed on U.S. market exchanges. This is a capitalization-weighted calculated on a total return basis with dividends reinvested. The S&P represents about 75% of the NYSE market capitalization.